Confusion
Self-Organizing Map (SOM) is an unsupervised neural network that is used to cluster multi-dimensional data. When the number of nodes in the neural network is small, it behaves very similar to k-Means algorithm. When the number of nodes in the neural network is large, it rerranges the data and keeps the original data topology (I haven’t totally understood what data topology is for now, but it does not affect our understanding of the algorithm).
Regrading the SOM algorithm, I understood the node position (in the weight space) is trying to move closer to each of the data point during the training (update the node weights closer to the data point). However, I had difficulties in understanding why the algorithm will finally converge. Say, if the weights of two nodes happened to be initialized to almost the same with very slight difference, and they are very far apart in the 2D neural network (Not weight space. In the weight space, their positions are extremely close.). 1) How does the model finally achieves that the node in the neural network and its neighbor nodes have similar weights (The nodes far apart have very different weights)? 2) If so, what happens to the two nodes with similar initialized weights I mentioned above during the learning iteration?
Intuition
I finally found a figure from the Wikipedia that totally explain all of my questions in an intuitive way. I would like to thank the author of the figure very much.
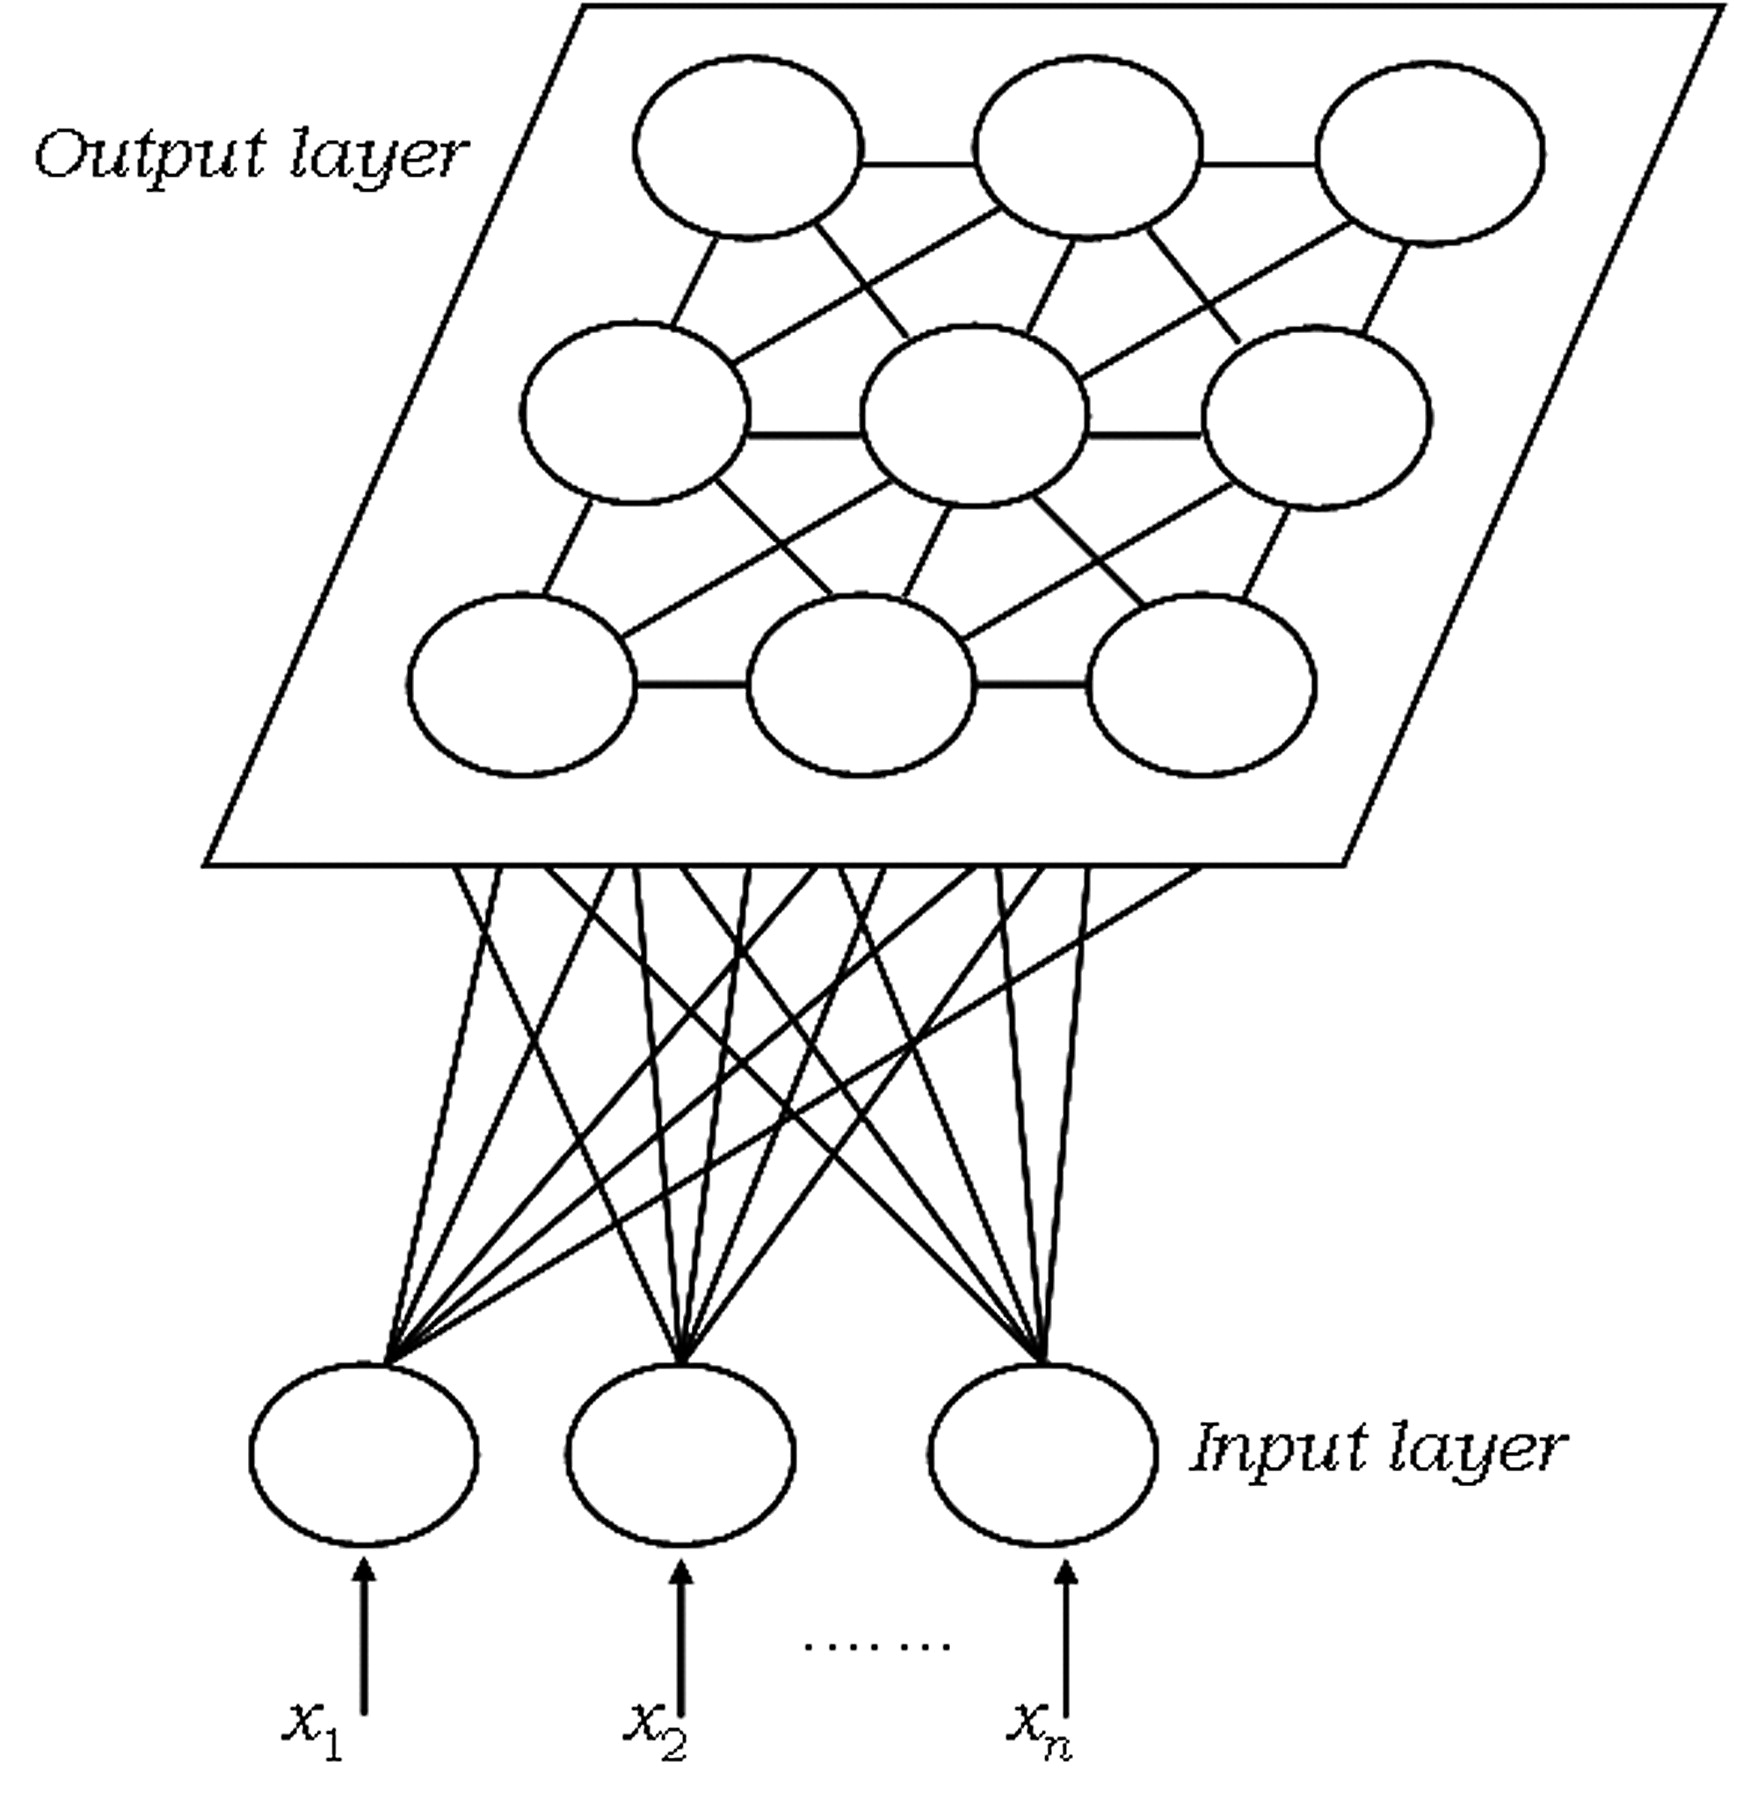
In an ordinary introduction material of self-organizing map, you will often see such kind of figure illustrating the SOM neural network. I personally think this is not helpful for readers to understand the algorithm, although it is correct.

The great figure from the Wikipedia is this:
I could add more comments to this figure. If you put the whole initialized neural network in the higer-dimensional weight space, it could “look” like “folded”, “wrapped”, meaning that any two nodes in neural network in the weight space could be very close to each other depending on the weight initialization. Your job, or what learning is going to do, is to “unfold” the initialized neural network, and use it to cover the whole data point set. So the answer to question 1 is automatically answered. The answer to question 2 is also very obvious. Although the two nodes initially sit very close to each other in the weight space, they might be separated apart because the whole neural network has to cover the whole data point set.

